Imagine you wake up with your dream holiday destination and jump on to explore more about it online. You search more about the place and enjoy reading information. And, you log into Facebook. What do you see? Advertisements of your dream destination pop up in every corner of the screen. It implies that smart digital assistants track your search and load you with additional information that might help you make your dream come true.
That is where Big Data and Data Analytics tools and techniques help unfold the world of hidden, yet targeted information.
A prediction says - each user would create 1.7 megabytes of new data every second. Within a year, there would be 44 trillion gigabytes of data accumulated in the world. This raw data needs to be analyzed for business decision-making, optimizing business performances, studying customer trends, and delivering better products and services.
There are many tools to assist this Data-Driven Decision-making process, and choosing the right tool is a challenge for data scientists or data analysts. Common queries that could run in your mind are: how many users use tools, how easy it is to learn, how it is placed in the market, and if you are a business owner, you may be concerned about the cost of ownership of such tools.
Top Data Analytics Tools
Here are the top 7 data analytics tools in vogue today:
- Python
- R
- SAS
- Excel
- Power BI
- Tableau
- Apache Spark
Let us walk through each of these tools.
1. Python

- Python was initially designed as an Object-Oriented Programming language for software and web development and later enhanced for data science. Python is the fastest-growing programming languages today.
- It is a powerful Data Analysis tool and has a great set of friendly libraries for any aspect of scientific computing.
- Python is free, open-source software, and it is easy to learn.
- Python’s data analysis library Pandas was built over NumPy, which is one of the earliest libraries in Python for data science.
With Pandas, you can just do anything! You can perform advanced data manipulations and numeric analysis using data frames.
Pandas support multiple file-formats; for example, you can import data from Excel spreadsheets to processing sets for time-series analysis. (By definition - Time-series analysis is a statistical technique that analyses time series data, i.e., data collected at a certain interval of time)
Pandas is a powerful tool for data visualizing, data masking, merging, indexing and grouping data, data cleaning, and many more.
To know more about Pandas, checkout Python Pandas Tutorials.
- Other libraries, such as Scipy, Scikit-learn, StatsModels, are used for statistical modeling, mathematical algorithms, machine learning, and data mining.
- Matplotlib, seaborn, and vispy are packages for data visualization and graphical analysis
- Python has an extensive developer community for support and is the most widely used language
- Top Companies that use Python for data analysis are Spotify, Netflix, NASA, Google and CERN and many more
2. R

- R is the leading programming language for statistical modeling, visualization, and data analysis. It is majorly used by statisticians for statistical analysis, Big Data and machine learning.
- R is a free, open-source programming language and has a lot of enhancements to it in the form of user written packages
- R has a steep learning curve and needs some amount of working knowledge of coding. However, it is a great language when it comes to syntax and consistency.
- R is a winner when it comes to EDA(By definition - In statistics, exploratory data analysis(EDA) is an approach to analyzing data sets to summarize their main characteristics, often with visual methods).
- Data manipulation in R is easy with packages such as plyr, dplyr, and tidy.
- R is excellent when it comes to data visualization and analysis with packages such as ggplot, lattice, ggvis, etc.
- R has a huge community of developers for support.
- R is used by
-
- Facebook - For behavior analysis related to status updates and profile pictures.
- Google - For advertising effectiveness and economic forecasting.
- Twitter - For data visualization and semantic clustering
- Uber - For statistical analysis
To know more about R you can visit here:
The Data Science Course 2024: Complete Data Science Bootcamp
3. SAS
- SAS is a statistical software suite widely used for BI (Business Intelligence), data management, and predictive analysis.
- SAS is proprietary software, and companies need to pay to use it. A free university edition has been introduced for students to learn and use SAS.
- SAS has a simple GUI; hence it is easy to learn; however, a good knowledge of the SAS programming knowledge is an added advantage to use the tool.
- SAS’s DATA step (The data step is where data is created, imported, modified, merged, or calculated) helps inefficient data handling and manipulation. SAS’s data analytics process is as shown:

- SAS’s Visual Analytics software is a powerful tool for interactive dashboards, reports, BI, self-service analytics, Text analytics, and smart visualizations.
- SAS is widely used in the pharmaceutical industry, BI, and weather forecasting.
- Since SAS is a paid-for service, it has a 24X7 customer support to help with your doubts.
- Google, Facebook, Netflix, Twitter are a few companies that use SAS.
- SAS is used for clinical research reporting in Novartis and Covance, Citibank, Apple, Deloitte and much more use SAS for predictive analysis
To know more about SAS you could visit here.
4. Excel

- Excel is a spreadsheet and a simple yet powerful tool for data collection and analysis.
- Excel is not free; it is a part of the Microsoft Office “suite” of programs.
- Excel does not need a UI to enter data; you can start right away.
- It is readily available, widely used and easy to learn and start on data analysis
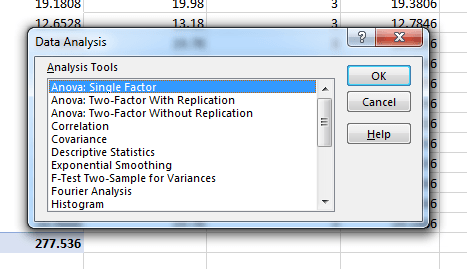
- The Data Analysis Toolpak in Excel offers a variety of options to perform statistical analysis of your data. The charts and graphs in Excel give a clear interpretation and visualization of your data, which helps in decision making as they are easy to understand.
The Analysis Toolpak feature needs to be enabled and configured in Excel, as shown.

Once the Toolpak has been set up, you will see the list of tools. You can choose the tool based on your goals and the information that you want to analyze.
- Excel is used by more than 750 million users across the world.
5. Power BI

- Power BI is yet another powerful business analytics solution by Microsoft.
- Power BI comes in three versions – Desktop, Pro, and Premium. The desktop version is free for users; however, Pro and Premium are priced versions.
- Youâ¯can visualizeâ¯your data connect to many data sources and share the outcomes across your organization.
- With Power BI, you can and bring your data to life with live dashboards and reports.
- Power BI integrates with other tools, including Microsoft Excel, so you can get up to speed quickly and work seamlessly with your existing solutions.
- Gartner says - Microsoft is a Magic Quadrant Leader among analytics and business intelligence platforms
- Top companies using Power BI are Nestle, Tenneco, Ecolab, and more.
To know more about Power BI, you can click on the link.
6. Tableau
- Tableau is a BI(Business Intelligence) tool developed for data analysts where one can visualize, analyze, and understand their data.
- Tableau is not free software, and the pricing varies as per different data needs
- It is easy to learn and deploy Tableau
To know and learn Tableau, you can visit the link.
- Tableau provides fast analytics; it can explore any type of data – spreadsheets, databases, data on Hadoop and cloud services
- It is easy to use as it has a powerful drag and drop features that anyone with an intuitive mind can handle.
- The data visualization with smart dashboards can be shared within seconds.
- Top companies that use Tableau are Amazon, Citibank, Barclays, LinkedIn, and many more.
7. Apache Spark

- Spark Is an integrated analytics engine for Big Data processing designed for developers, researchers, and data scientists.
- It is free, open-source and a wide range of developers contribute to its development
- It is a high-performance tool and works well for batch and streaming data.
- Learning Spark is easy, and you can use it interactively from the Scala, Python, R, and SQL shells too.
- Spark can run on any platform such as Hadoop, Apache Mesos, standalone, or in the cloud. It can access diverse data sources.
- Spark includes libraries such as
-
- for SQL and structured data - SparkSQL
- Machine learning - MLlib
- Live dataStream processing - SparkStreaming
- Graph analytics - GraphX.
- Uber, Slack, Shopify, and many other companies use Apache Spark for data analytics.
To know and learn Apache Spark, you can visit the link.
Summary
I am sure by now; you would have got a fair understanding of data analytics tools. For you to move ahead in your data analytics journey and search for the right tool, you need to invest quite a bit of your time in understanding your and/or your organization’s data needs, and then scout around analyzing various tools available in the market and then decide.
People are also reading:
- What is Data Analytics?
- Top Data Analytics Certification
- What is Data Analysis?
- Data Science Interview Questions
- How to Become a Data Analyst with no Experience
- Difference between Data Analyst vs Data Scientist
- Difference between Machine learning and Artificial Intelligence
- Difference between Data Science vs Machine Learning
- Difference between Data Science vs Data Analytics
- Difference between Hadoop vs Spark
- Top Deep Learning Books