Data Science has been transformational for IT and business in general. This ever-expanding area seeks to extract hidden value from data by uncovering and understanding patterns to predict outcomes, train machine learning models, or better understand a data set's big picture.
In an era of massive data generation, data science is in huge demand by companies that want to analyze their data to generate optimized business insights and to increase profits or efficiency.
Data scientists play an essential role here since they organize, evaluate, and study data and its patterns.
What Are Data Science Tools?
Aside from having the appropriate qualifications and education, aspiring data scientists must be skilled in top data science tools.
This includes fluency in at least one tool from the data science lifecycle: data acquisition or capture, data processing or cleaning, data warehousing, data exploration or analysis, and data visualization.
With the help of the best data science tools, professionals can generate business solutions from data by identifying relevant questions, collecting data from relevant sources, organizing and transforming data, and analyzing this to communicate findings for better business decisions.
Generally, we can divide data science tools into two areas, namely those for programmers and those for non-programmers.
This article provides the top data science tools list and how each of them can help you, whether you’re an aspiring data scientist with little programming experience or a seasoned pro.
Data Acquisition & Data Cleansing Tools
Converting raw data into sensible and potentially valuable data for business users and organizations is a big challenge for data-driven companies with massive volumes of data.
ETL (Extract, Transform & Load) tools are the go-to combined solution for gathering data from various sources and performing data preprocessing to convert it to a logical format for further analyses.
These tools perform data processing by extracting it from underlying sources, transforming it to fit a predefined schema, and then finally loading it into the target destination (databases, data warehouses, or data lakes). Here are some of the most popular ETL data science software tools.
1. Talend

Talend is an open-source data science tool that enables data processing, integration, and application integration. The advantages of this tool include real-time statistics, easy scalability, efficient management, early cleansing, faster design, better collaboration, and native code.
Key Features:
- Efficient task development & deployment: automate and maintain current tasks
- User-focused: open-source and unified platform with a huge community
- Advanced technology: regularly updated for current and future user requirements
2. IBM Datacap
IBM Datacap can acquire documents, extract information, and deliver documents to other downstream business processes on the backend, leveraging flexibility, accuracy, and automation.
This data science tool uses natural language processing (NLP), text analytics, and machine learning (ML) technologies to automatically identify, extract, and classify content from unstructured or variable documents.
It can also handle multi-channel processing of paper documents from scanners, multifunction peripherals, and fax machines.
This software can help data scientists reduce labor and paper costs, deliver meaningful information, and support faster decision-making.
Key features:
- Enriched mobility: capture and submit documents with smartphones or tablets. Also offers iOS and Android SDKs to embed Datacap mobile functionality into your own iOS and Android apps
- Robotic Process Automation (RPA): insert advanced document recommendations using IBM RPA via automation
- Intelligent capture: automatically classifies and extracts content and context from unstructured, complex, or highly variable documents via machine learning
- Data protection & content management: protect sensitive data and enable content collaboration to censor high-level information
Suggested Course
The Data Science Course 2024: Complete Data Science Bootcamp
3. Mozenda
Mozenda is an enterprise cloud-based web-scraping platform that helps data scientists collect and organize web data for efficient and cost-effective preprocessing.
Key features:
- User-friendly UI: point-and-click design is easy to use
- Two-part application: application to build data extraction projects, and web console to run agents, organize results, and export data
- Broad format support: publish results in CSV, TSV, XML, or JSON
- API access: useful for programmatic data fetching
- Storage integration: support for FTP, Amazon S3, Dropbox, and more
4. Octoparse
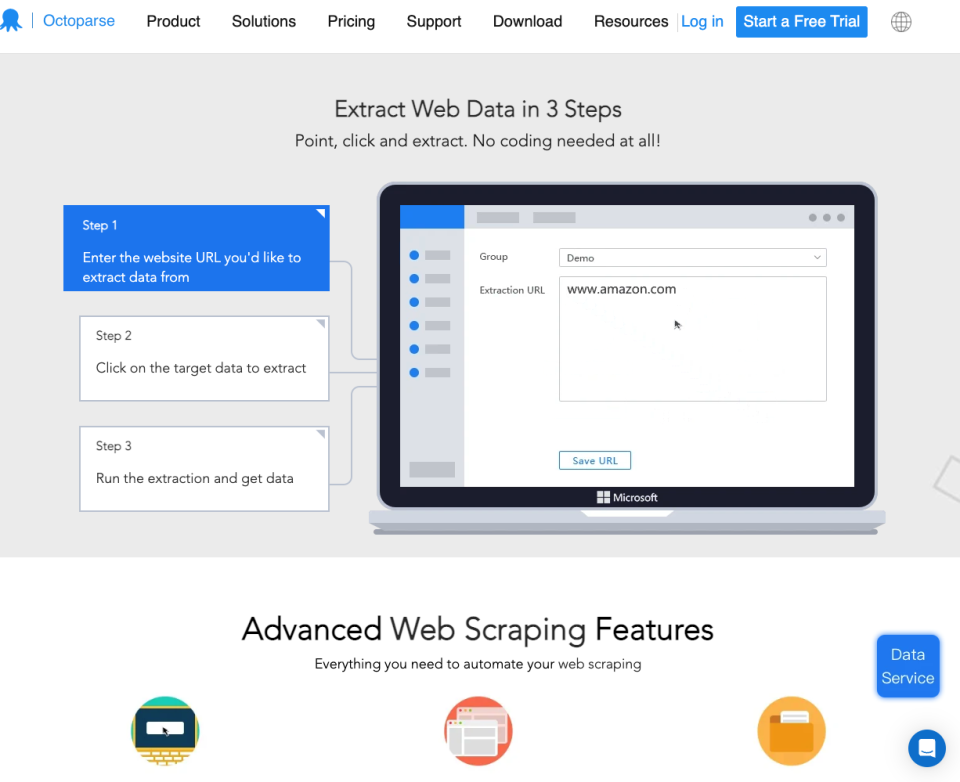
Octoparse is client-side web scraping software designed for Windows. It uses a web-scraping template to turn unstructured or semi-structured website data into structured data sets without needing to write any code.
A web scraping template is a simple yet powerful feature that takes user input for a target website or keyword and then passes these to a pre-formatted task.
This means the user doesn't have to configure any scraping rules or write code, which makes Octoparse a helpful tool for people without programming experience.
5. OnBase

OnBase is an enterprise information platform designed to manage user content, processes, and cases. This tool centralizes user business content in a secure location and delivers relevant information to a user when they need it.
It can help an organization become more agile, efficient, and capable when seeking to increase productivity, provide excellent customer service, and reduce enterprise risk.
Key features:
- Single platform: build content-based applications and complement core business systems
- Low-code development: rapidly create content-enabled solutions to reduce cost and development times
- Versatile deployment: deployable in the cloud, on mobile devices, and can be integrated with existing applications
Want to discover more data science tools? Check out the 10 Top Data Science Applications
Data Warehousing Tools
Data warehousing is the process of transforming and storing data into usable and useful formats that make it easy for business users or data scientists to conduct analysis.
The primary purpose of data warehousing is to collect and manage data from various sources to provide a clean, up-to-date, and centralized data repository that can be analyzed to extract meaningful business insights. Let’s take a look at some data warehousing tools.
1. Amazon Redshift

Amazon Redshift is a petabyte-scale, fully managed cloud data warehouse service that allows enterprises to scale from a few hundred gigabytes of data to much more.
As one of the most powerful examples of data science software, it enables data scientists to extract business and customer insights from data.
Redshift utilizes nodes called Amazon Redshift clusters, which allow users to upload datasets to the data warehouse after being provisioned. Users can then perform analysis and queries on the data.
Key features:
- Virtual Private Cloud (VPC): launch within an AWS VPC to have a private cloud network to access and control the cluster
- Data encryption: stored data can be encrypted while creating tables
- SSL: client connections encrypted to Redshift
- Scalable: number of nodes can be easily scaled with a few clicks
- Cost-effective: no up-front costs or long-term commitments, and on-demand pricing
2. Google BigQuery

BigQuery is a highly scalable and serverless data warehouse tool for data processing and analysis. With no infrastructure to manage, data scientists can focus on finding meaningful insights via SQL without the need for a database administrator.
This tool implements a logical data warehouse with columnar storage for data from object storage and spreadsheets. It also offers fast dashboards and reporting via the in-memory BI engine, and users can leverage SQL for machine learning of geospatial analysis solutions.
BigQuery allows data scientists to securely share insights within the organization and beyond as datasets, queries, spreadsheets, and reports.
Key features:
- Serverless: launch data warehouses in seconds with no time-consuming resource allocation tasks, reduced downtime, and automatic scaling
- Real-time analytics: high-performance ingestion of real-time streaming data
- Third-party integration: use ETL tools like Talend to enrich user data, and BI tools like Tableau, MicroStrategy, Looker, and Data Studio for reporting & dashboards
- Data protection: automatic data replication for disaster recovery and high availability at no extra cost
3. Microsoft Azure

Microsoft Azure is an ever-expanding set of cloud services to build, manage, and deploy applications on a massive global network.
This includes various services that can be combined to form a data warehouse, such as data storage, data processing, data analytics, hybrid integration, artificial intelligence (AI) and machine learning (ML), databases, and development.
Key features:
- Disaster Recovery (DR): whether implementing a cloud-based data warehouse or a cloud backup, have access to data at all times
- Pricing: pay-as-you-go model & cost management tools optimize warehousing costs
- Reputation: one of the major cloud providers on a global scale, competing with Google Cloud Platform (GCP), Amazon Web Services(AWS), and IBM
4. MySQL

MySQL is an open-source Relational Database Management System (RDBMS) that uses SQL (Structured Query Language) for database administration and queries.
MYSQL databases can be used to implement a data warehousing solution, as they provide a familiar and convenient method for data scientists to interact with and analyze data. This allows data scientists to store, clean, and visualize data directly from the database.
Key features:
- Data collection: import data into a database in various formats, including XLS, CSV, XML, and more
- Data preprocessing & cleaning: easily remove incomplete or irrelevant data (dirty data) with SQL functions such as LIKE, TRIM, REPLACE, etc
- Analysis and visualizations: implement SQL queries to analyze data and generate visualizations
5. Snowflake

Snowflake is a fully relational ANSI SQL data warehouse that allows users to leverage various top data science tools and skills already used by their organization.
In particular, data scientists can implement familiar SQL tasks like updates, deletes, functions, transactions, stored procedures, views, and joins to analyze data in a Snowflake warehouse.
Key features:
- Zero management: automatically handles infrastructure, availability, optimization, data protection, and more
- Diverse data: wide support for traditional and modern machine-generated business data without transformations, natively loads/optimizes structured & semi-structured data in JSON, Avro, or XML to make it available via SQL with no loss in performance/flexibility
- Performance: process queries in a fraction of the time of on-premises and other cloud warehouses, columnar database engine uses automatic clustering to load raw data, and excellent performance via scaling in either direction
- Failover and continuity: data replicated across cloud regions to provide business continuity and a backup in the event of a failover
- Share data seamlessly: multi-tenant architecture implements secure and governed data sharing via Data Sharehouse, allowing data sharing with organizations, business partners, and customers in minutes without moving data
Want to level up your SQL skills to become a data warehousing pro? Check out our SQL Cheat Sheet
Data Analysis Tools
Data analysis is the process of cleaning, modeling, and transforming data to discover useful information or patterns for business decision-making.
Analysis tasks for data scientists include data extraction, cleansing, profiling, and more. There are several methods and techniques for data analysis.
- Text analysis: discover patterns in large data sets & convert raw data into helpful business information
- Statistical analysis: utilize existing data for descriptive analysis (averages, standard deviation, etc.) and inferential analysis (hypothesis testing, sample properties, etc.)
- Diagnostic analysis: find the ‘why’ behind insights from statistical analysis
- Predictive analysis: predict future possibilities from previous data
- Prescriptive analysis: combine insights from each of the earlier stages to decide on a course of action
Some of the best tools for data science, and specifically data analysis are listed below.
1. Alteryx

Alteryx is a data analytics and automation platform targeted toward data scientists.
Key features:
- Accelerates analysis: no time-consuming need to search for data to analyze due to end-to-end analytic process
- Combines data from multiple sources: can import structured and unstructured data from Hadoop and Excel, creating the correct data set for analysis or visualization
- Predictive, statistical, and spatial analyses: 60+ built-in tools for spatial and predictive analytics, regression, or clustering. These can be customized, or you can create new tools using Python or R
- Data sharing: export reports to visualization formats like Qlik, Tableau, and Microsoft Power BI for sharing with decision-makers
2. Domino Data Lab

Domino automates DevOps for data scientists, freeing up time for research and testing more ideas more quickly. Automatic work tracking also enables reproducibility, reusability, and collaboration.
Key features:
- Domino workbench: load your preferred data science tools and infrastructure; track, reproduce, and compare experiment results; find, discuss, and re-use work
- Kubernetes deployment: deploy low-latency & high-availability APIs, monitor data & performance drift, one-click publish interactive apps like Shiny or Flask, and schedule jobs for model training or ETL
- Manage data: monitor & control computing utilization, oversee data science projects, and examine data science products to understand their inner workings
3. KNIME Analytics Platform

KNIME is a free and open-source platform for data analytics and reporting that makes data, data science workflows, and reusable components accessible to all users without the need to code.
Key features:
- Build workflows: create visual workflows with a drag-and-drop UI with zero code, or use Python/R, Apache Spark, & other data science tools
- Wide data support: import CSV, PDF, XLS, JSON, & XML text formats, unstructured data types, time-series data, database & data warehouse data, and Twitter, AWS S3, & Google Sheet data
- Modify, query & shape data: implement statistical analysis, correlation analysis, data type conversion, aggregate functions, and more
- Machine learning: build models for classification, linear and logistic regression, dimensionality reduction, clustering, deep learning, and more
- Data visualization: create and customize classic (bar charts, scatter plots) and advanced charts (parallel coordinates, sunburst, network graph, heat map)
- Performance optimization: scaled workflow via multi-threaded processing, and distributed computing via Apache Spark enhances performance
4. Rapid Miner

Rapid Miner is a data science platform developed for non-programmers and data scientists that need quick data analysis.
This set of data science tools also supports importing ML models to web apps like flask or NodeJS, along with Android and iOS apps.
Key features:
- Simplifies data tasks: condense scattered data mining and analysis tasks
- Varied framework support: load data from Hadoop, cloud services, RDBMS, NoSQL, PDFs, and more
- Data preprocessing: prepare data using industry-standard methods, create new child tables, join tables, or interpolate missing data
- Machine learning & AI: train AI and deep learning models like random forest & gradient boost and implement clustering to prune outliers
- Deployment options: run models in the cloud or the local production environment
Interested in learning more about data analytics? Check out the 7 Top Data Analytics Tools
Data Visualization Tools
Data visualization involves representing data in a visual or graphical format. This can help decision-makers visually examine analytics or understand patterns and complex concepts better.
Data visualization requires skills from various disciplines, including scientific visualization, graphic design, and statistical graphics.
Data scientists can take multiple approaches to create data visualizations, the most popular being the ‘information presentation’. This includes a blend of statistical graphics and thematic maps or images.
Data visualization tools can display information in sophisticated ways, including infographics, dials and gauges, geographic maps, sparklines, heat maps, bar charts, pie charts, fever charts, and more. There are several use cases for data visualizations.
- Communicating insights: demonstrate data-driven insights in ways that are clear to all workers in an organization, whatever their background
- Examine Big Data: businesses need to quickly and easily summarize data with visualizations as they continue to accumulate massive quantities
- Assess models: data scientists can examine model result visualizations during development, which is easier to interpret than numerical data for complex algorithms
1. Google Fusion Tables

Fusion Tables is a Google web service for data management. You can gather, visualize, and share data tables, which other users can view and download.
Users have various visualization options, including bar charts, line plots, pie charts, timelines, scatterplots, and geographical maps. Charts that you produce can be exported as CSV files.
Key features:
- Larger tables online: access more extensive data tables online when creating visualizations, and these can be published online
- Combine tables: merge up to three tables to extend your data set before creating visualizations
- Instant maps: generate maps from location tables in minutes, and these can be shared
- Online hosting: data tables and visualizations can be stored online and offered with API access to collaborators
2. Microsoft Power BI

Microsoft Power BI is an analytics service that can find data insights and produce visualizations in the cloud. Users can transform data into impressive visuals and share them with any device.
Key features:
- Intelligence clouds: create and share interactive data visualizations across global data centers, including public clouds
- AI assistance: non-data-scientists can take advantage of AI to prepare structured & unstructured data, which can be used to produce visualizations
- Excel integration: easily connect Office365 Excel queries, data models, and reports to Power BI Dashboards
- Real-time streaming: real-time analytic data from factory sensors to social media sources can be used to produce visualizations
3. Qlik Sense

Qlik Sense is a visual analytics platform you can use for analytics dashboards, embedded analytics, and visualization, all in a scalable and governed framework.
Users have a drag-and-drop interface to create interactive data visualizations that present findings in a storytelling format.
Key features:
- Associative model: combine and explore all of your data to create visualizations that answer business questions
- Interactive charts: instant updates to charts when data changes
- Visualization library: range of smart visualizations to show data shape and highlight outliers
- Insight Advisor: auto-generated data analysis with chart recommendations to create fast and insightful visualizations
4. SAS

SAS is statistical software for data science that was developed for advanced analytics, business intelligence, data management, predictive analysis, and data visualization.
Key features:
- Interactive dashboards: move directly from reporting, to exploration, to analysis, to sharing interactive visualizations inside a single interface
- Smart visualization: automatic charting and advanced visualization techniques
- Location analytics: adds location data to provide a geographical context for visualizations
Conclusion
With more data being generated than ever, businesses of all sizes are looking to leverage data science to optimize business practices, increase profits, and improve efficiency.
As a data scientist, you’re expected to be fluent in various top data science tools and programming languages. Data science tools are crucial for analyzing data, creating powerful predictive models using machine learning algorithms, and creating aesthetic and interactive visualizations.
Many data science tools allow you to perform complex operations in a single interface, making it easy to implement various data science projects. Of course, some tools may require you to know SQL, Python, R, or other programming languages. Still, many also allow you to perform these essential data science activities without needing to write any code.
Using the best data science tools for the task at hand makes it possible to uncover and communicate essential business insights to your organization, leading to better business decisions.
Looking to become a Data Scientist? Check out this Data Science course that covers the A-Z of Data Science skills.
Frequently Asked Questions
1. Is Python a Data Science Tool?
Python is a versatile language that can be used for various tasks, including data science. While not explicitly designed for data science, it can be used for a range of data-related tasks. It also has many libraries for data science, including NumPy, pandas, and Matplotlib.
2. What Is the Most Popular Data Science Tool?
It is difficult to say due to the vast depth of the data science toolkit and the different categories of tools. But, some of the most popular data acquisition tools include Talend and IBM Datacap, while Amazon Redshift and BigQuery are popular for data warehousing. And, of course, Python is incredibly popular as a data science tool/skill.
3. Where Is Data Science Mostly Used?
Data science is used to understand current trends and patterns and help make future decisions. It can help you understand how people interact with your product, what they think of it, and how they might use it in the future. It helps to make better decisions by analyzing data and developing predictive models.